Attractiveness Test: How Attractive Am I?
Upload one front-facing photo. You get an attractiveness score out of 10, a breakdown of four facial features, and which of the four scores lowest.
Free to use. The analysis runs on your own device.
Analyze your face
Measured from 478 facial landmarks with fixed formulas. Runs entirely in your browser.
The Attractiveness Scale: What Your Score Out of 10 Means
Your score is a number from 0 to 10 with one decimal place. If you came here to rate your looks 1-10, this is that number. It combines four feature scores into one figure, and the same photo always returns the same score.
Every score lands in one of five tiers.
| Score | Tier | What it means |
|---|---|---|
| 9.5–10 | Exceptional | The highest tier. Few faces reach it, even in clear, front-facing photos. |
| 7.8–9.4 | Attractive | Well above the most common tier. Your result names the lowest of your four feature scores, the one with the most room left. |
| 6.0–7.7 | Appealing | The most common tier among clear, front-facing photos. Your result names the lowest of your four feature scores. That is the place to start. |
| 5.0–5.9 | Rising | Several features have room to move, starting with the one your result names. |
| Below 5.0 | Foundation | Scores this low usually come from the photo: a small head turn that still passes the photo check can pull the numbers down. Retake it facing the camera straight on first. |
Your result also shows how your score compares with 1000+ reference faces.
Is 6.5 or 7 out of 10 attractive? Both land in the Appealing tier, the most common tier among real front-facing photos, and the Attractive tier starts at 7.8. Other sites draw their tier lines in other places, so a 6.5 here and a 6.5 elsewhere can describe different faces. When you compare tools, look past the totals to the raw measurements, such as jaw width to cheekbone width. A raw ratio can be compared across tools that measure it the same way; a tier label cannot.
The five tiers line up with the PSL scale, an 8-point rating scale used in looksmax communities.
What the Test Measures: Four Facial Features
Your score is built from four features. Each one gets its own score out of 10, shown as a bar in your result.
Harmony · 32% of the score
Nine proportions across the whole face, including face width to height, the three vertical thirds, eye spacing and mouth width. Each is scored against its own reference range, and your result card shows the face width to height ratio.
Width to height also feeds the face shape testSymmetry · 26%
How much the left half of your face differs from a mirrored copy of the right half, averaged across regions. Smaller differences score higher.
See your symmetry region by regionEye area · 21%
Five measurements: canthal tilt (the angle from the inner to the outer corner of each eye, reference 4° to 8° upward), eye shape, eye spacing, the gap between brow and eye, and how closely the two eyes match in size.
Measure your canthal tilt in degreesJawline · 21%
Five measurements: jaw width to cheekbone width (reference 0.75 to 0.85), chin width, the lower third of the face, the curve of the jaw, and how centered the chin is.
Your result names the lowest-scoring of the four. That is the one to look at first.
How the AI Attractiveness Test Works
1.Find the face.
An AI face-landmark model places 478 points on your face, covering the eye corners, brows, nose, lips and jawline.
2.Measure.
The points are converted into distances, angles and ratios, and each one is compared with its reference range.
3.Score.
The four feature scores are weighted and combined into one number out of 10.
All three steps run in your browser, on your own device. Every step is a fixed calculation, so the same photo gets the same score every time. A different photo of you scores differently only when the geometry in it changes, and the next section covers what changes it.
Why the Same Face Gets Different Scores
"I used my best picture and got like a 6, then took a crappy selfie and got a 9.8." Complaints like this come up again and again in Reddit threads about face-rating tools. In most cases the face stayed the same and the photo changed.
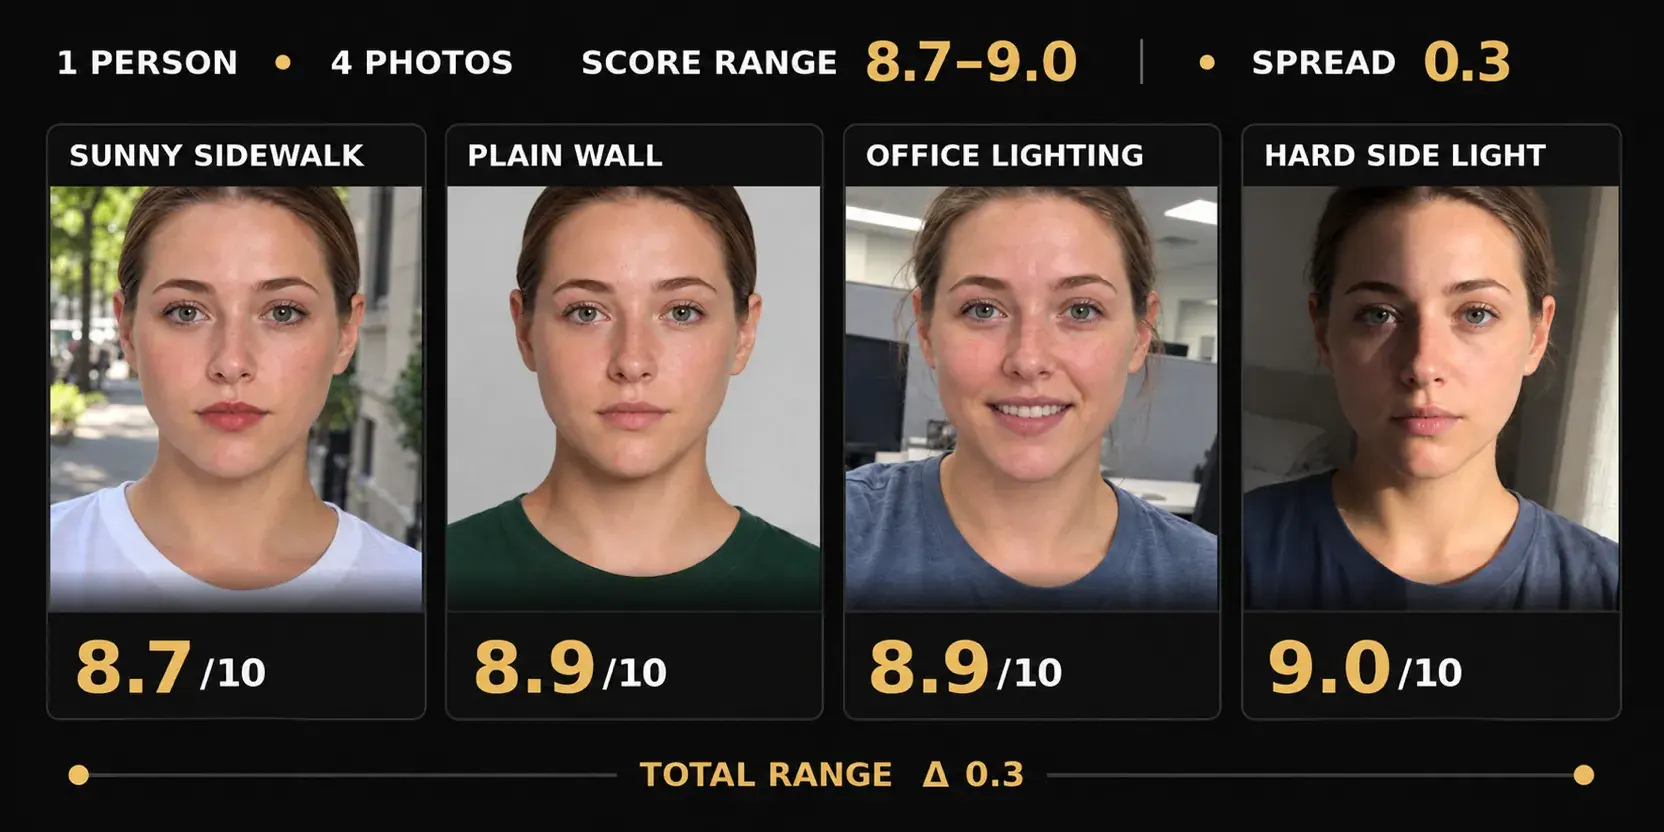
Same face, four photos: 8.7–9.0
We ran five everyday photos of the same person through the test. Four of them, taken on a sunny sidewalk, against a plain wall, in an office under ceiling lights, and by a bedroom window with strong side light, scored 8.7, 8.9, 8.9 and 9.0. That is a spread of 0.3 points, within the test's margin of error.
Lighting, background, makeup and expression changed how these photos looked far more than they changed the score.
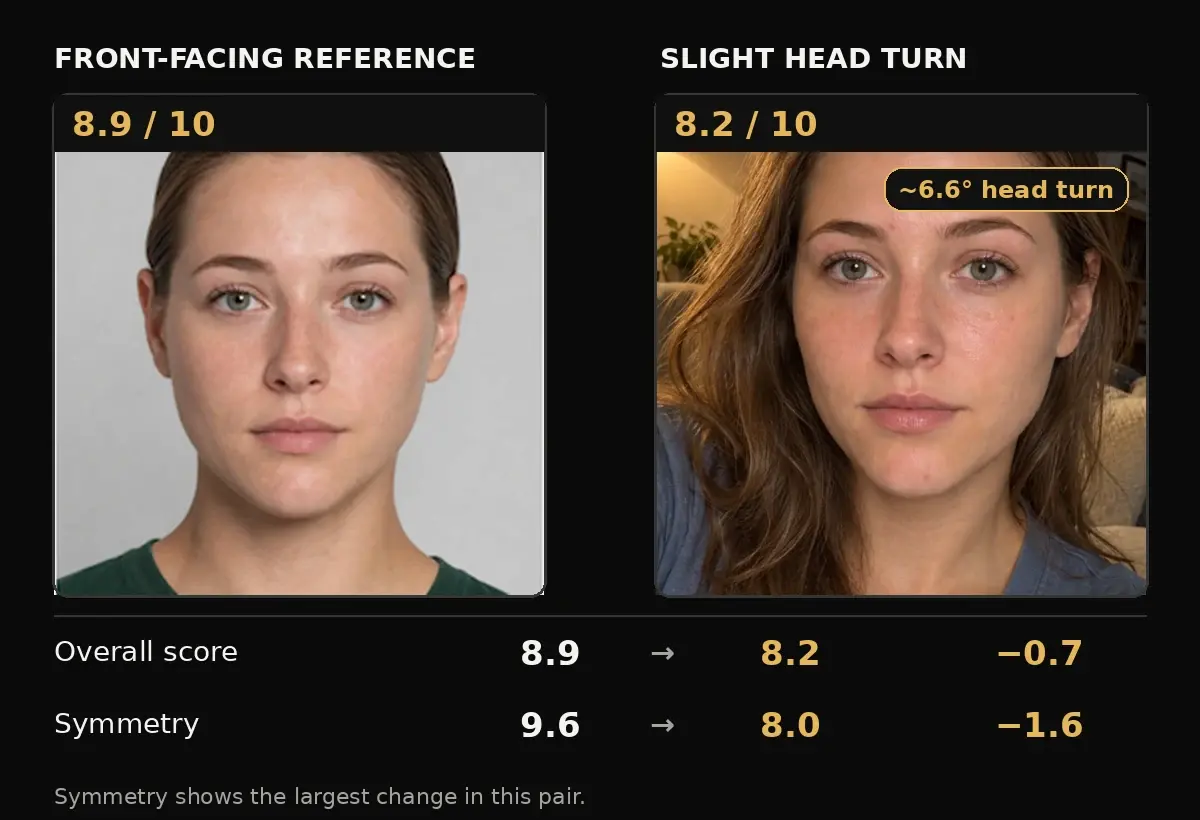
The fifth photo, a slight head turn: 8.9 → 8.2
The fifth photo, a close-up selfie at home, scored 8.2, against 8.9 for the plain-wall photo. The test measured about 6.6° of head turn, and Symmetry changed the most, falling from 9.6 to 8.0, the same pattern the head-angle row below describes.
A head turn can change the geometry the camera sees. One side of the face sits closer to the lens, so the two halves may no longer line up the way they do in a straight-on photo. For a more repeatable result, face the camera directly and keep your head level.
| What changed | What it does | Which scores move | What to do |
|---|---|---|---|
| Camera distance | Close-range selfies make the nose and middle of the face look wider (Ward et al., 2018) | Harmony, jawline | Prop the phone about 5 feet (1.5 m) away and use the timer, or at least hold it at full arm's length |
| Head angle | Turning the head to one side shifts where the points land | Symmetry, eye area | Face the camera straight on, head level |
| Lighting | Strong light from one side hides half the face; studies find faces are rated lower once the light moves far off to the side | Whether the photo passes the check | Face a window or another source of even light |
| Expression | A smile lifts the eye corners and widens the lower face | Eye area, jawline | Keep a relaxed, neutral face for the measurement |
Before measuring, the test checks your photo for head angle, sharpness and exposure. If your photo doesn't pass, the test tells you why.
To compare scores over time, try to keep two things the same: the distance to the camera, and a straight-on, level head. That keeps your scores consistent from one test to the next.
After Your Score: What Actually Moves It
Research points to a handful of changes that shift how attractive people find a face, none of them medical. Some move your score on this test. Others change how people see you in person, outside what a photo can measure. Both are below.
If this is your lowest score
Harmony
Check the photo first: Harmony reads proportions across the whole face, so camera distance moves it more than any other score. A selfie from arm's length or closer widens the middle of the face (Ward et al., 2018). Retake it from about 5 feet away with the timer.
Beyond the photo: These proportions come mostly from bone structure.
Symmetry
Check the photo first: A head turned even slightly to one side reads as asymmetry, because one half of the face is closer to the camera. A sideways head tilt does not count against you, since the test measures from a center line that follows the tilt. A lopsided smile does, so keep a neutral face.
Beyond the photo: Every face has small differences between its halves. The face symmetry test breaks yours down region by region.
Face symmetry testEye area
Check the photo first: Squinting, a wide smile or raised brows change your eye shape and the gap between brow and eye. Look into the lens with your eyes fully open and your face relaxed.
Beyond the photo: Brows are the one part of this score you can reshape directly; the brow card below has the research. The canthal tilt test measures the angle of your eyes on its own.
Canthal tilt testJawline
Check the photo first: Tilting your chin up or down changes the lower-third and jaw-curve readings. Keep your head level. Hair or a scarf over the jaw edge can also throw the points off.
Beyond the photo: The jaw is mostly bone structure. The face shape test shows how your jaw width compares with your cheekbones.
Face shape testMoves how people see you
Sleep.
In a 2017 study, strangers rated people slightly less attractive after two nights of about four hours' sleep than after normal sleep (Sundelin et al., 2017). An earlier study in the BMJ found a similar drop after a single night without sleep (Axelsson et al., 2010).
A real smile.
Smiling is one of the most studied cues in attractiveness research, and most of that work finds it helps. A smile also changes your eye and jaw measurements, so keep a neutral face for this test and smile everywhere else.
Even skin tone.
Faces with more even color are rated healthier and more attractive (Fink et al., 2012). Daily sunscreen and a steady skincare routine are the everyday habits that protect it.
Groomed brows.
Brows are one of the few facial features you can reshape directly, and studies find brow shape affects how attractive a face is rated (Baker et al., 2007).
The ratios this test reads come mostly from bone structure, so some of your four scores will stay close to where they are. Your result shows where the largest gap is, and the list above covers what you can change starting today.
Five ways compared
Rate My Face: Five Ways to Find Out How Attractive You Are
Most people who ask "am I attractive" try more than one of these. Each answers a slightly different question.
- Same photo, same score
- This test — Every time. Each step is a fixed calculation.
- Other ways — A chatbot's score shifts with how you phrase the question, and a Reddit rating depends on who happens to reply.
- What drove the number
- This test — Four feature scores, each with a key measurement and a reference range or target.
- Other ways — Many online tests give one number with no breakdown.
- Where to start
- This test — Names the lowest of the four features.
- Other ways — Comments on r/Rateme drift into personality or dating, and a single score from other tests does not show where to begin.
- Honest by design
- This test — A calculation has no reason to flatter you.
- Other ways — Friends are kind by default, and "ChatGPT loves to glaze" is a common verdict on Reddit.
- Whose taste
- This test — Measured geometry, compared with reference ranges.
- Other ways — Many online tests predict a rating from photos people already scored, so the result carries those raters' tastes.
- Photo check
- This test — Checks head angle, sharpness and exposure first and tells you what to fix.
- Other ways — A chatbot or a stranger will still rate a turned-away, badly lit selfie.
- Your photo
- This test — The analysis runs on your own device.
- Other ways — Chatbots upload your photo to their servers, and a rating subreddit makes it public.
This test measures facial geometry. In a photo, people also see your skin, style and expression, and in person, your presence.
About friends and your own eyes: you mostly see your face in a mirror, flipped left to right, while everyone else sees it unflipped. A 1977 study found people prefer the mirror image of their own face, while their friends prefer the true one (Mita, Dermer & Knight, 1977).
The most useful answer combines two of these: a measurement you can repeat, and the views of people whose opinion matters to you.
Where Attractiveness Tests Came From, and the Types Used Today
Rating faces online is older than the smartphone. People voted first, then models learned from their votes, then chatbots joined in.
1990
Psychologists found that faces blended together by computer were rated more attractive than almost any of the single faces used to make them (Langlois & Roggman, 1990).
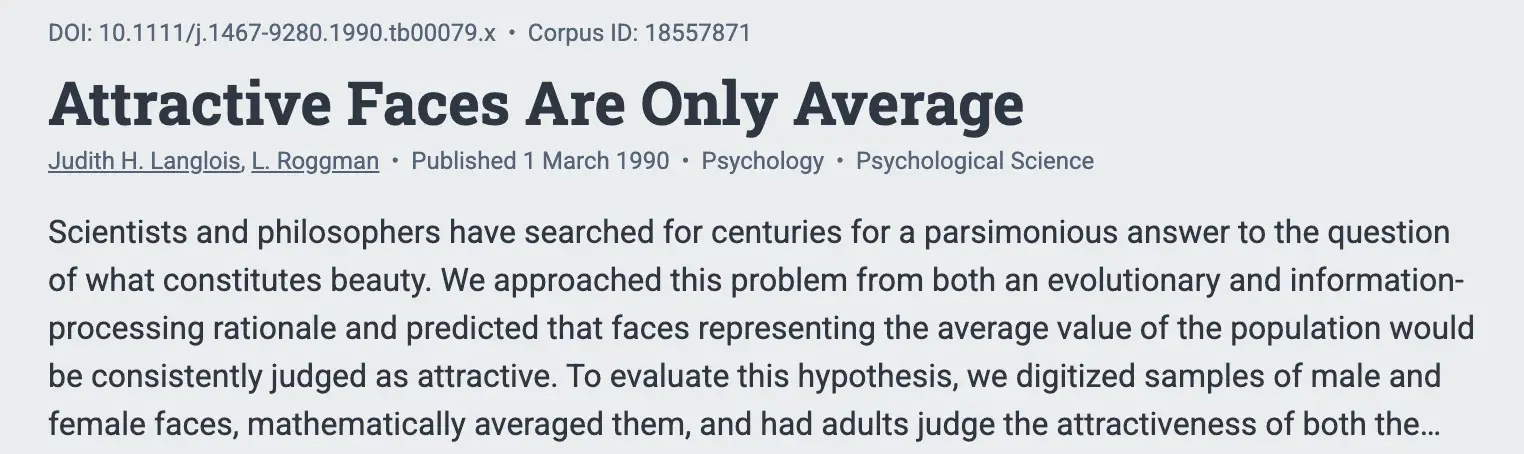
Langlois and Roggman, 1990. Abstract on Semantic Scholar. 2000
Hot or Not launched in October 2000 and let visitors score uploaded photos from 1 to 10.
2003
Facemash put two student photos side by side and asked which one was more attractive.
2006
A study trained a model on human beauty ratings and reached a 0.65 correlation with average human judgments (Eisenthal, Dror & Ruppin, 2006).
2016
Beauty.AI ran the first beauty contest judged by AI and drew about 6,000 entries. Most of its winners were white, and the organizers said the training data had too few darker-skinned faces.
2018
Public research datasets followed, such as SCUT-FBP5500: 5,500 faces, each rated by 60 volunteers.
2023
ChatGPT gained the ability to read uploaded images in September 2023. Asking a chatbot to rate your selfie out of 10 has since become a recurring trend on TikTok and YouTube Shorts, and Google's Gemini gets the same request.
2024
Fortune reported on the "looksmaxxing" app economy. The founder of one face-scoring app said it had passed 7 million downloads, and that most of its users were men aged 16 to 45. Psychologists quoted in the piece raised concerns about what constant scoring does to young men's body image.
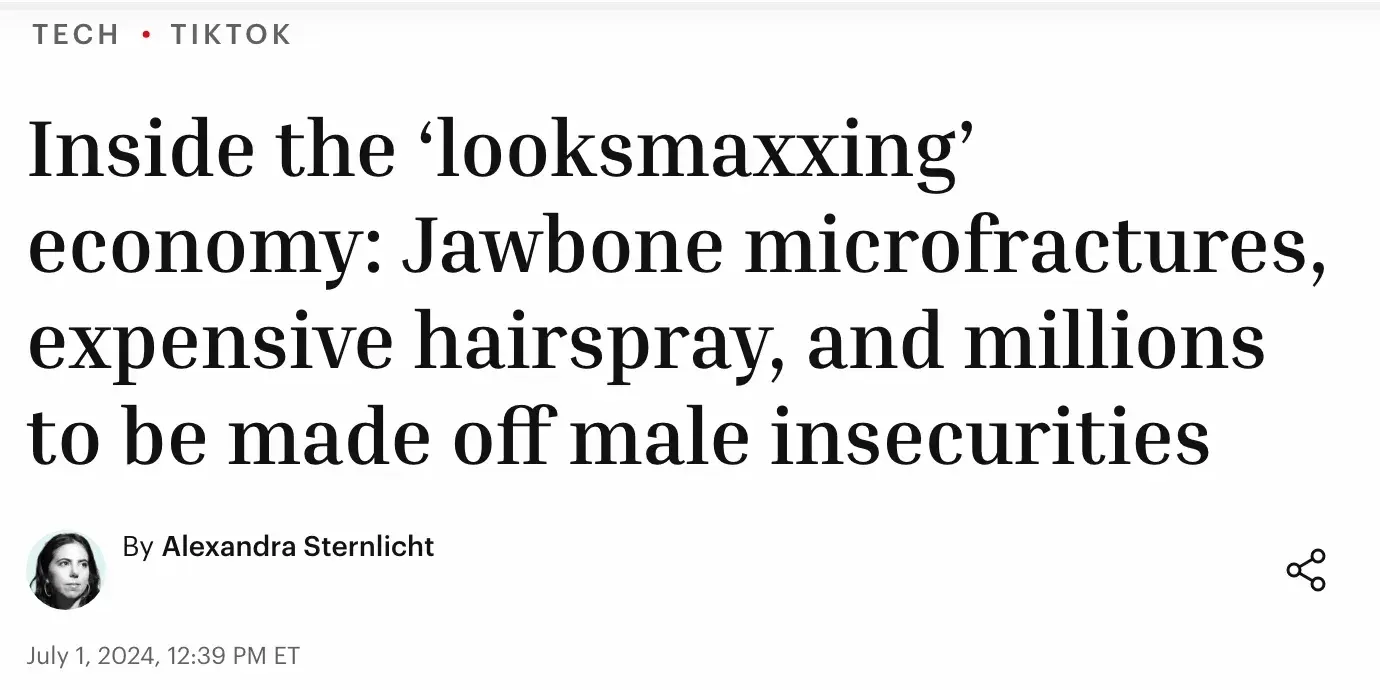
Fortune, July 1, 2024.
Today's tests reach a number in one of four ways.
| Kind | How it gets a number | Examples |
|---|---|---|
| Crowd ratings | People look at your photo and vote | Rating subreddits, peer-rating sites |
| Model predictions | A model trained on photos people already rated guesses the rating yours would get | Most sites and apps sold as an "AI attractiveness test" |
| Geometric measurement | Points on the face become ratios, compared with reference ranges | This test |
| Chatbots | A general AI looks at your selfie and gives an opinion | ChatGPT, Gemini |
Many tools mix two of these. Knowing which one produced your score tells you what it actually measures.
What a Photo Can and Can't Tell You
A photo can show proportion, spacing and symmetry, and research ties those to attractiveness. A 2006 review of the evidence found that averageness, symmetry and sex-typical features are rated attractive in both men and women, across cultures (Rhodes, 2006).
A single still photo leaves out close-up skin texture, how your face moves when you speak, your voice, your style, and the warmth people feel toward someone they know. Those shape how people see you in person.
A photo test can compare you with a fixed set of faces. Your result shows where your score sits among reference faces measured the same way. That describes how your photo compares with those faces; how people react to you in person is a separate question.
Many tools lean on the golden ratio. Its best-known version, Stephen Marquardt's "phi mask", was criticized in a 2008 surgery journal for fitting mostly white fashion models (Holland, 2008). This test scores each ratio against its own reference range.
If your score came back lower than you hoped: it describes the geometry of one photo. A different distance or head angle can move it, and much of what people notice about you in person sits outside it. Start with the photo setup and the feature your result names, then retest the same way.
Attractiveness Test FAQ
References
Sources cited on this page, with the claim each one supports.
- 1. Langlois, J. H., & Roggman, L. A. "Attractive Faces Are Only Average." Psychological Science, 1990.
Computer-blended faces are rated more attractive than almost any single face used to make them.
- 2. Eisenthal, Y., Dror, G., & Ruppin, E. "Facial Attractiveness: Beauty and the Machine." Neural Computation, 18(1), 2006, 119-142.
A 2006 study trained a model on human beauty ratings and reached a 0.65 correlation with average human judgments.
- 3. Xie, D., Liang, L., Jin, L., Xu, J., & Li, M. "SCUT-FBP5500: A Diverse Benchmark Dataset for Multi-Paradigm Facial Beauty Prediction." arXiv:1801.06345, 2018.
SCUT-FBP5500 contains 5,500 faces, each rated by 60 volunteers.
- 4. Levin, Sam. "A beauty contest was judged by AI, and the robots didn't like dark skin." The Guardian, 2016-09-08.
Beauty.AI ran the first beauty contest judged by AI, drew about 6,000 entries, and most winners were white due to a training-data gap.
- 5. OpenAI. "GPT-4V(ision) System Card." 2023-09-25.
ChatGPT gained the ability to read uploaded images in September 2023.
Other ways into the same measurements
Full facial analysis
Thirteen measurements from the same photo, with every input shown.
The PSL scale, tier by tier
What the 0 to 8 scale divides up, and where the numbers behind it come from.
Face shape detector
Which of the seven shapes the photo lands in, and the ratios behind the call.
Face symmetry test
How far the two halves of your face diverge, measured region by region.
Canthal tilt test
The angle of each eye in degrees, and how much of it comes from how the photo was taken.
Lip shape analyzer
Nine lip types, plus the thickness and balance of your own mouth, read from a photo.